


Index shows huge increase in consumer health care costs
- Details
- Published on 08 May 2015
- Written by PRNewswire


 While the U.S. government has become an even more dominant force in the nation's health care system, individuals are taking on a greater share of the costs, according to the new U.S. News Health Care Index.
The index was developed exclusively by U.S. News & World Report as an ongoing way to track health care's changing role in the U.S. economy and society. The first series of data, from 2000 to 2013, presents a comprehensive overview of the U.S. health care system by following movements in health care expenditures, medical costs, insurance coverage, health care employment, international comparisons and health care degrees granted in the United States.
"There is an ongoing narrative about health care's central role in the U.S. economy, but this index demonstrates all of the ways health care is touching every aspect of our society," said Tim Smart, executive editor of U.S. News. "The Health Care Index will allow us to better understand how the health care system is evolving and its broader influence over time."
The index shows a steady trend upwards between 2000 and 2013. The largest components – health care expenditures and employment – drive the trend.
Key insights from the U.S. News Health Care Index:
- An expansion of public health insurance: Though data from the Affordable Care Act are not measured in the first iteration of the index, the federal government's expanded role is already apparent. Government-sponsored health care, including Medicare and Medicaid, have grown at a faster rate than private health insurance. The total percentage of people under the age of 65 with public health insurance coverage increased from 12.9 percent in 2000 to 23.8 percent in 2013. Private health insurance coverage decreased from 71.8 percent to 61 percent during the same period.
- A surge in individual's health care costs: Americans have taken on a higher burden of health care costs, spending 1.7 times more out-of-pocket on health care by 2013. The average cost of deductibles more than doubled over the course of a decade. The percent of premiums paid by employees increased by roughly 4 percent for both single and family plans, taking up a larger share of individual incomes. Meanwhile, there has been a 55 percent growth in prescription drug consumer prices.
- A dominant role in the U.S. economy: In 2012, the U.S. spent 17.9 percent of its GDP on health care, more than any other developed nation. Health care's share of the job market has declined since 2011, but health care jobs have steadily increased every year, from 9.7 million in 2000 to 12.5 million in 2013. There continues to be an uptick in undergraduate and graduate health care degrees granted. From 2000 to 2013, associate degrees increased 142 percent, bachelors grew by 126 percent and graduate degrees increased by 94 percent.
The U.S. News Health Care Index features a collection of interactive graphs so that users can easily explore the data, research specific data points and adjust the graphs to illustrate trends. The index (read full methodology) is made up of 36 data sets organized into eight sub-indices: health care expenditures, employment, insurance, education, insurance premiums, consumer price, insurance deductibles, and international economic impact.
The index relies on data from the U.S. Bureau of Labor Statistics, the Centers for Medicare and Medicaid Services, the United States Centers for Disease Control and Prevention, the Department of Health and Human Services, the National Center for Educational Statistics and the World Health Organization.
Symphony closes its season with Mahler
- Details
- Published on 07 May 2015
- Written by The Peorian
The music of Gustav Mahler will highlight the Peoria Symphony Orchestra’s final concert of the season Saturday in the Peoria Civic Center Theater.
 The concert, titled “Gustav Mahler, Symphony No. 7,” begins at 8 p.m. and will close the Peoria Symphony’s 117th season.
This will be the first time in the Peoria Symphony’s history that this piece will be performed, the PSO said in a news release. “Nearly 100 musicians will take the stage prepared to devote themselves to this enormous work, which includes some of Mahler’s most dark and introspective music, but ultimately ends with a bright, exultant finale,” the release said.
The concert will be 75 minutes of continuous music without an intermission.
Written 110 years ago the work was given the nickname “Song of the Night” because of its two movement titled “Nachtmusik.” Mahler himself stated this work is a passage from night to day and that in this symphony “nature roars!”
Peoria Symphony music director Maestro George Stelluto issued a warning that “This music could blow your mind!”
“Mahler himself resisted the idea that his music was programmatic. However, there is no doubt that it contains deep influences of both the sounds and psychological-emotional experiences of his life, Stelluto wrote in a recent newsletter.
“The Symphony No. 7’s changing moods and schizophrenic outbursts more closely resemble (musically) a Freudian dream than an awakened autobiography. It might be a musical insight into how we process our thoughts and experiences unconsciously in order to make sense of our conscious world,” he wrote.
Tickets for the concert start at $28 (only $10 for students) and are available online at www.peoriasymphony.org or they can be ordered by calling (309) 671-1096. The Symphony box office at 101 State Street is open 10 a.m. to 4 p.m. Friday and at the Civic Center on Saturday beginning at 7 p.m.
Pryor has a permanent place in Peoria. Finally.
- Details
- Published on 05 May 2015
- Written by Kevin Kizer
On a Sunday afternoon that saw temperatures reach the 80s, Richard Pryor Jr. was dressed in a full tuxedo under the harsh glare of the sun. He couldn’t have looked cooler.
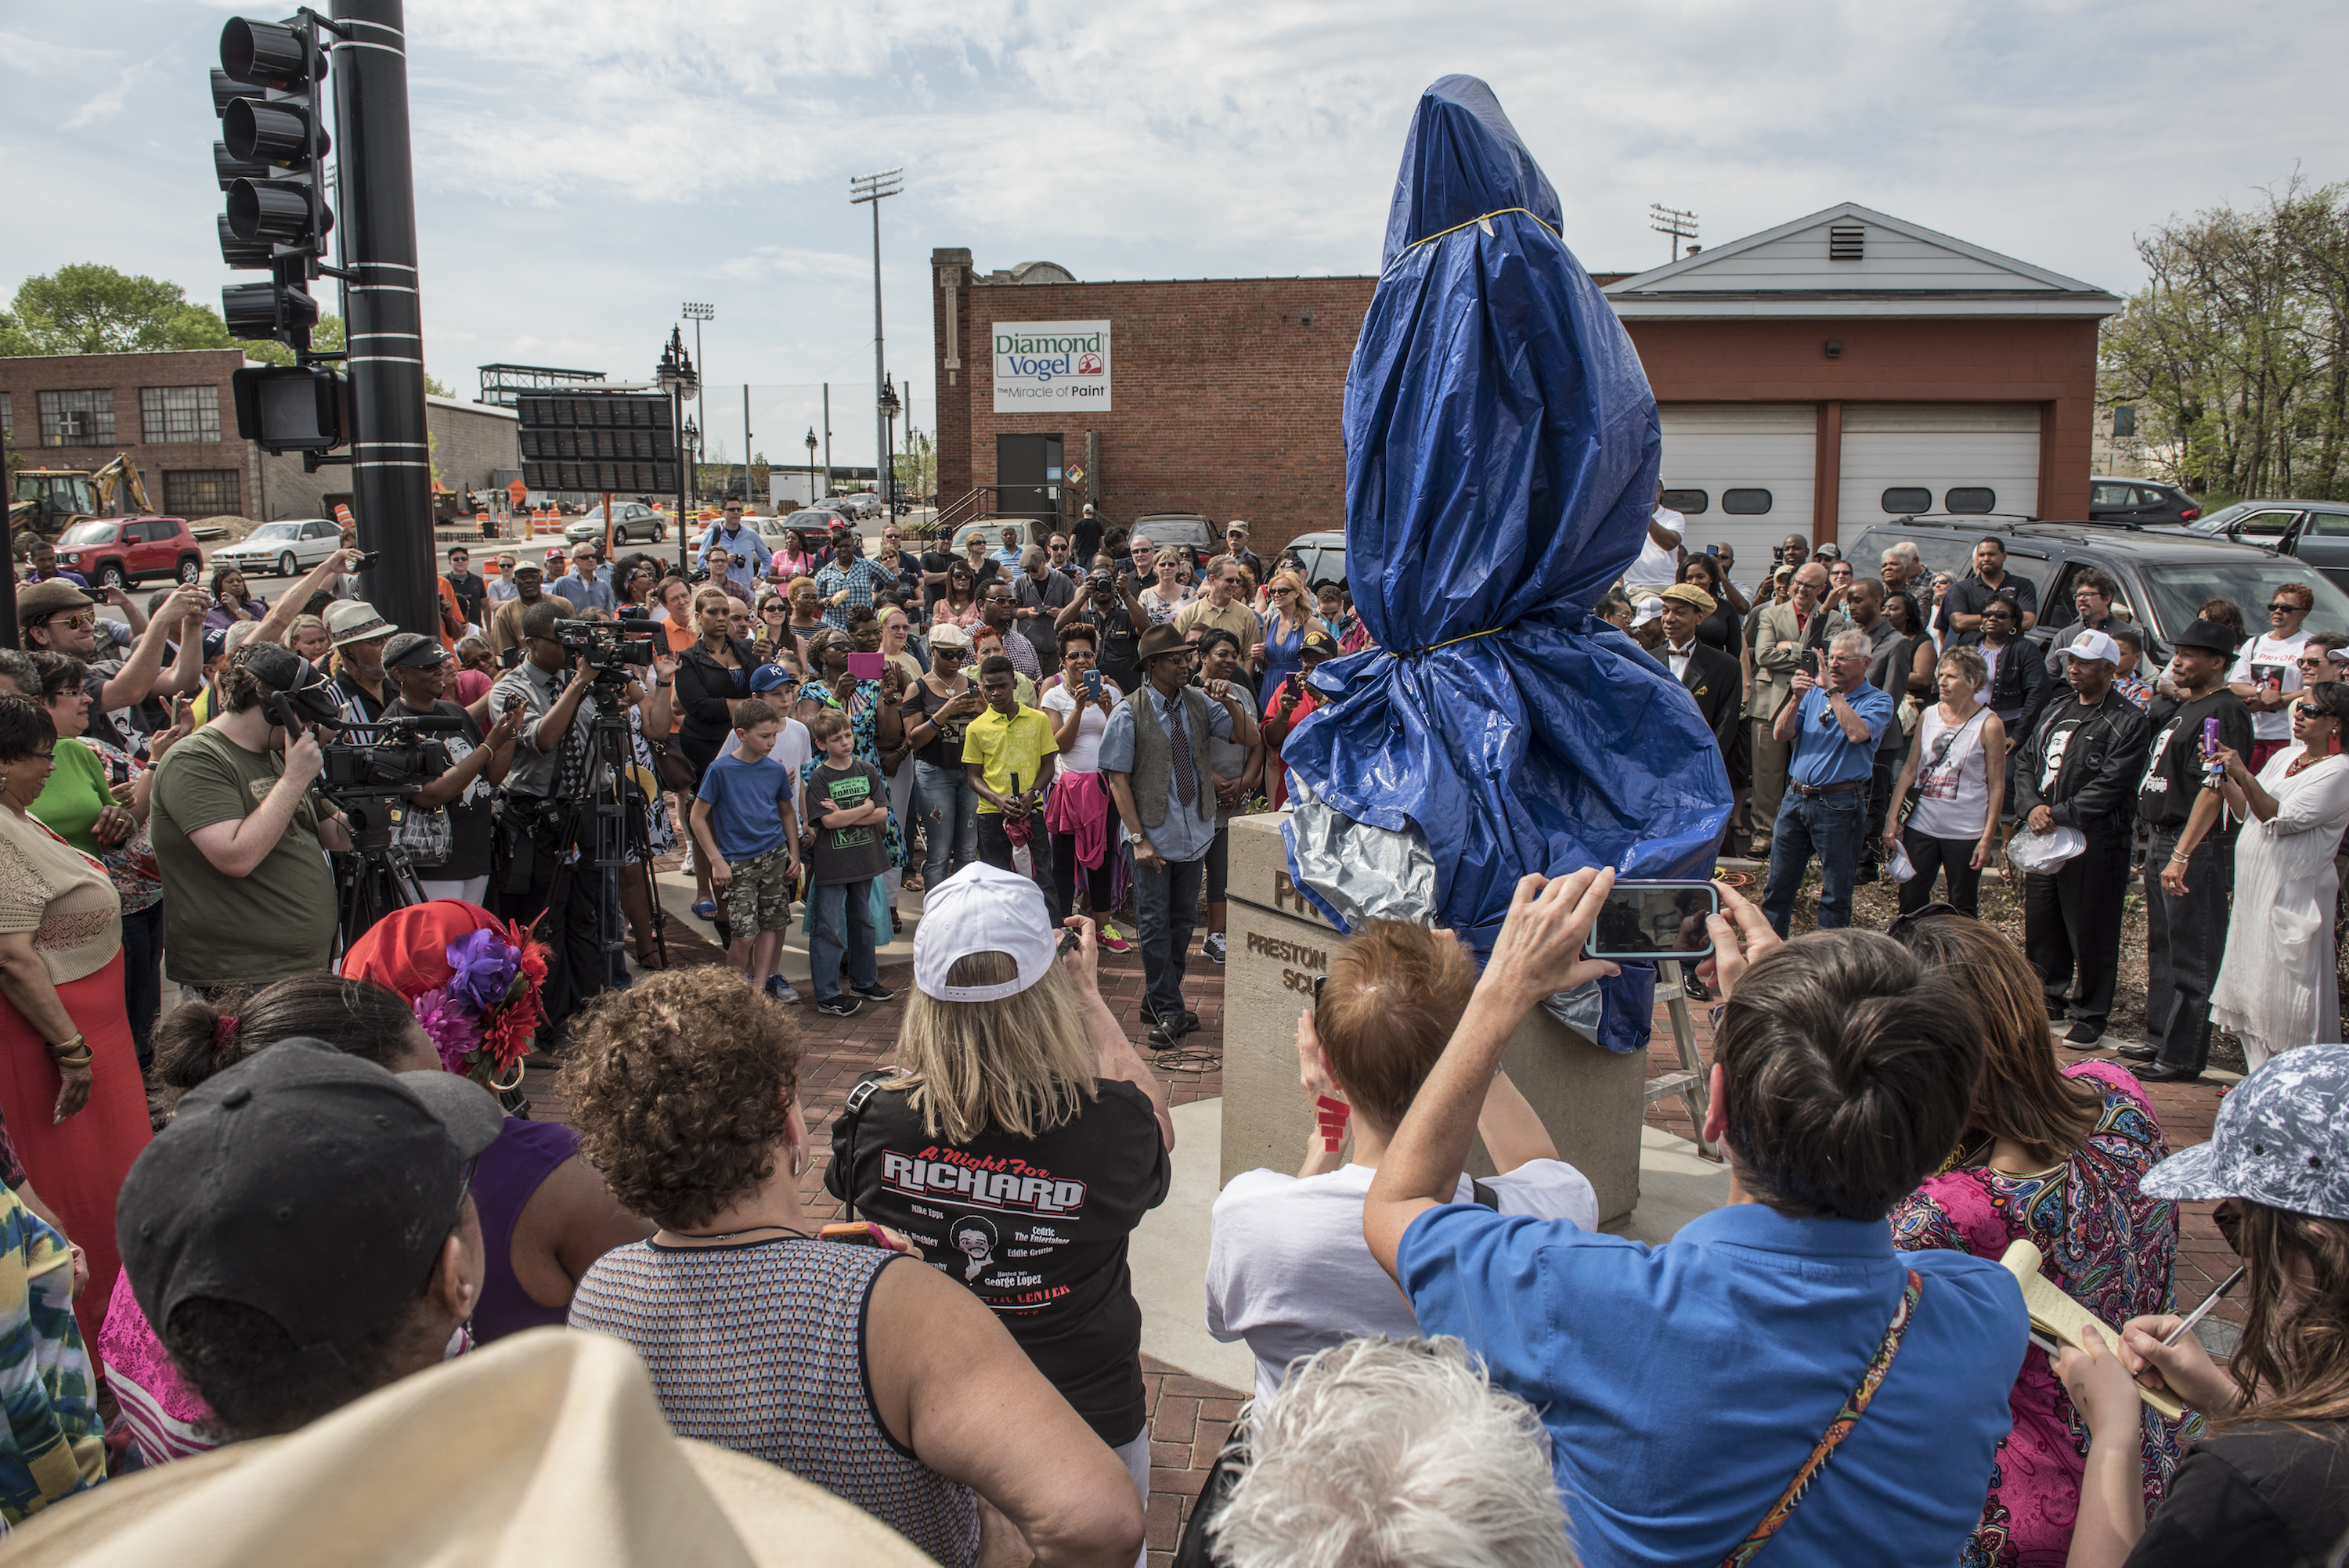
After all, it was on this Sunday, May 3, 2015, that the statue of his father, Richard Pryor, was unveiled at the corner of State and Washington Streets in Peoria’s Warehouse District.
“We can really hold our heads up high and feel proud…it’s not too often you see a parent or a family member immortalized in bronze,” said Richard Jr. reflecting on the event afterwards. “And then to see people taking pictures with him? It’s awesome.”
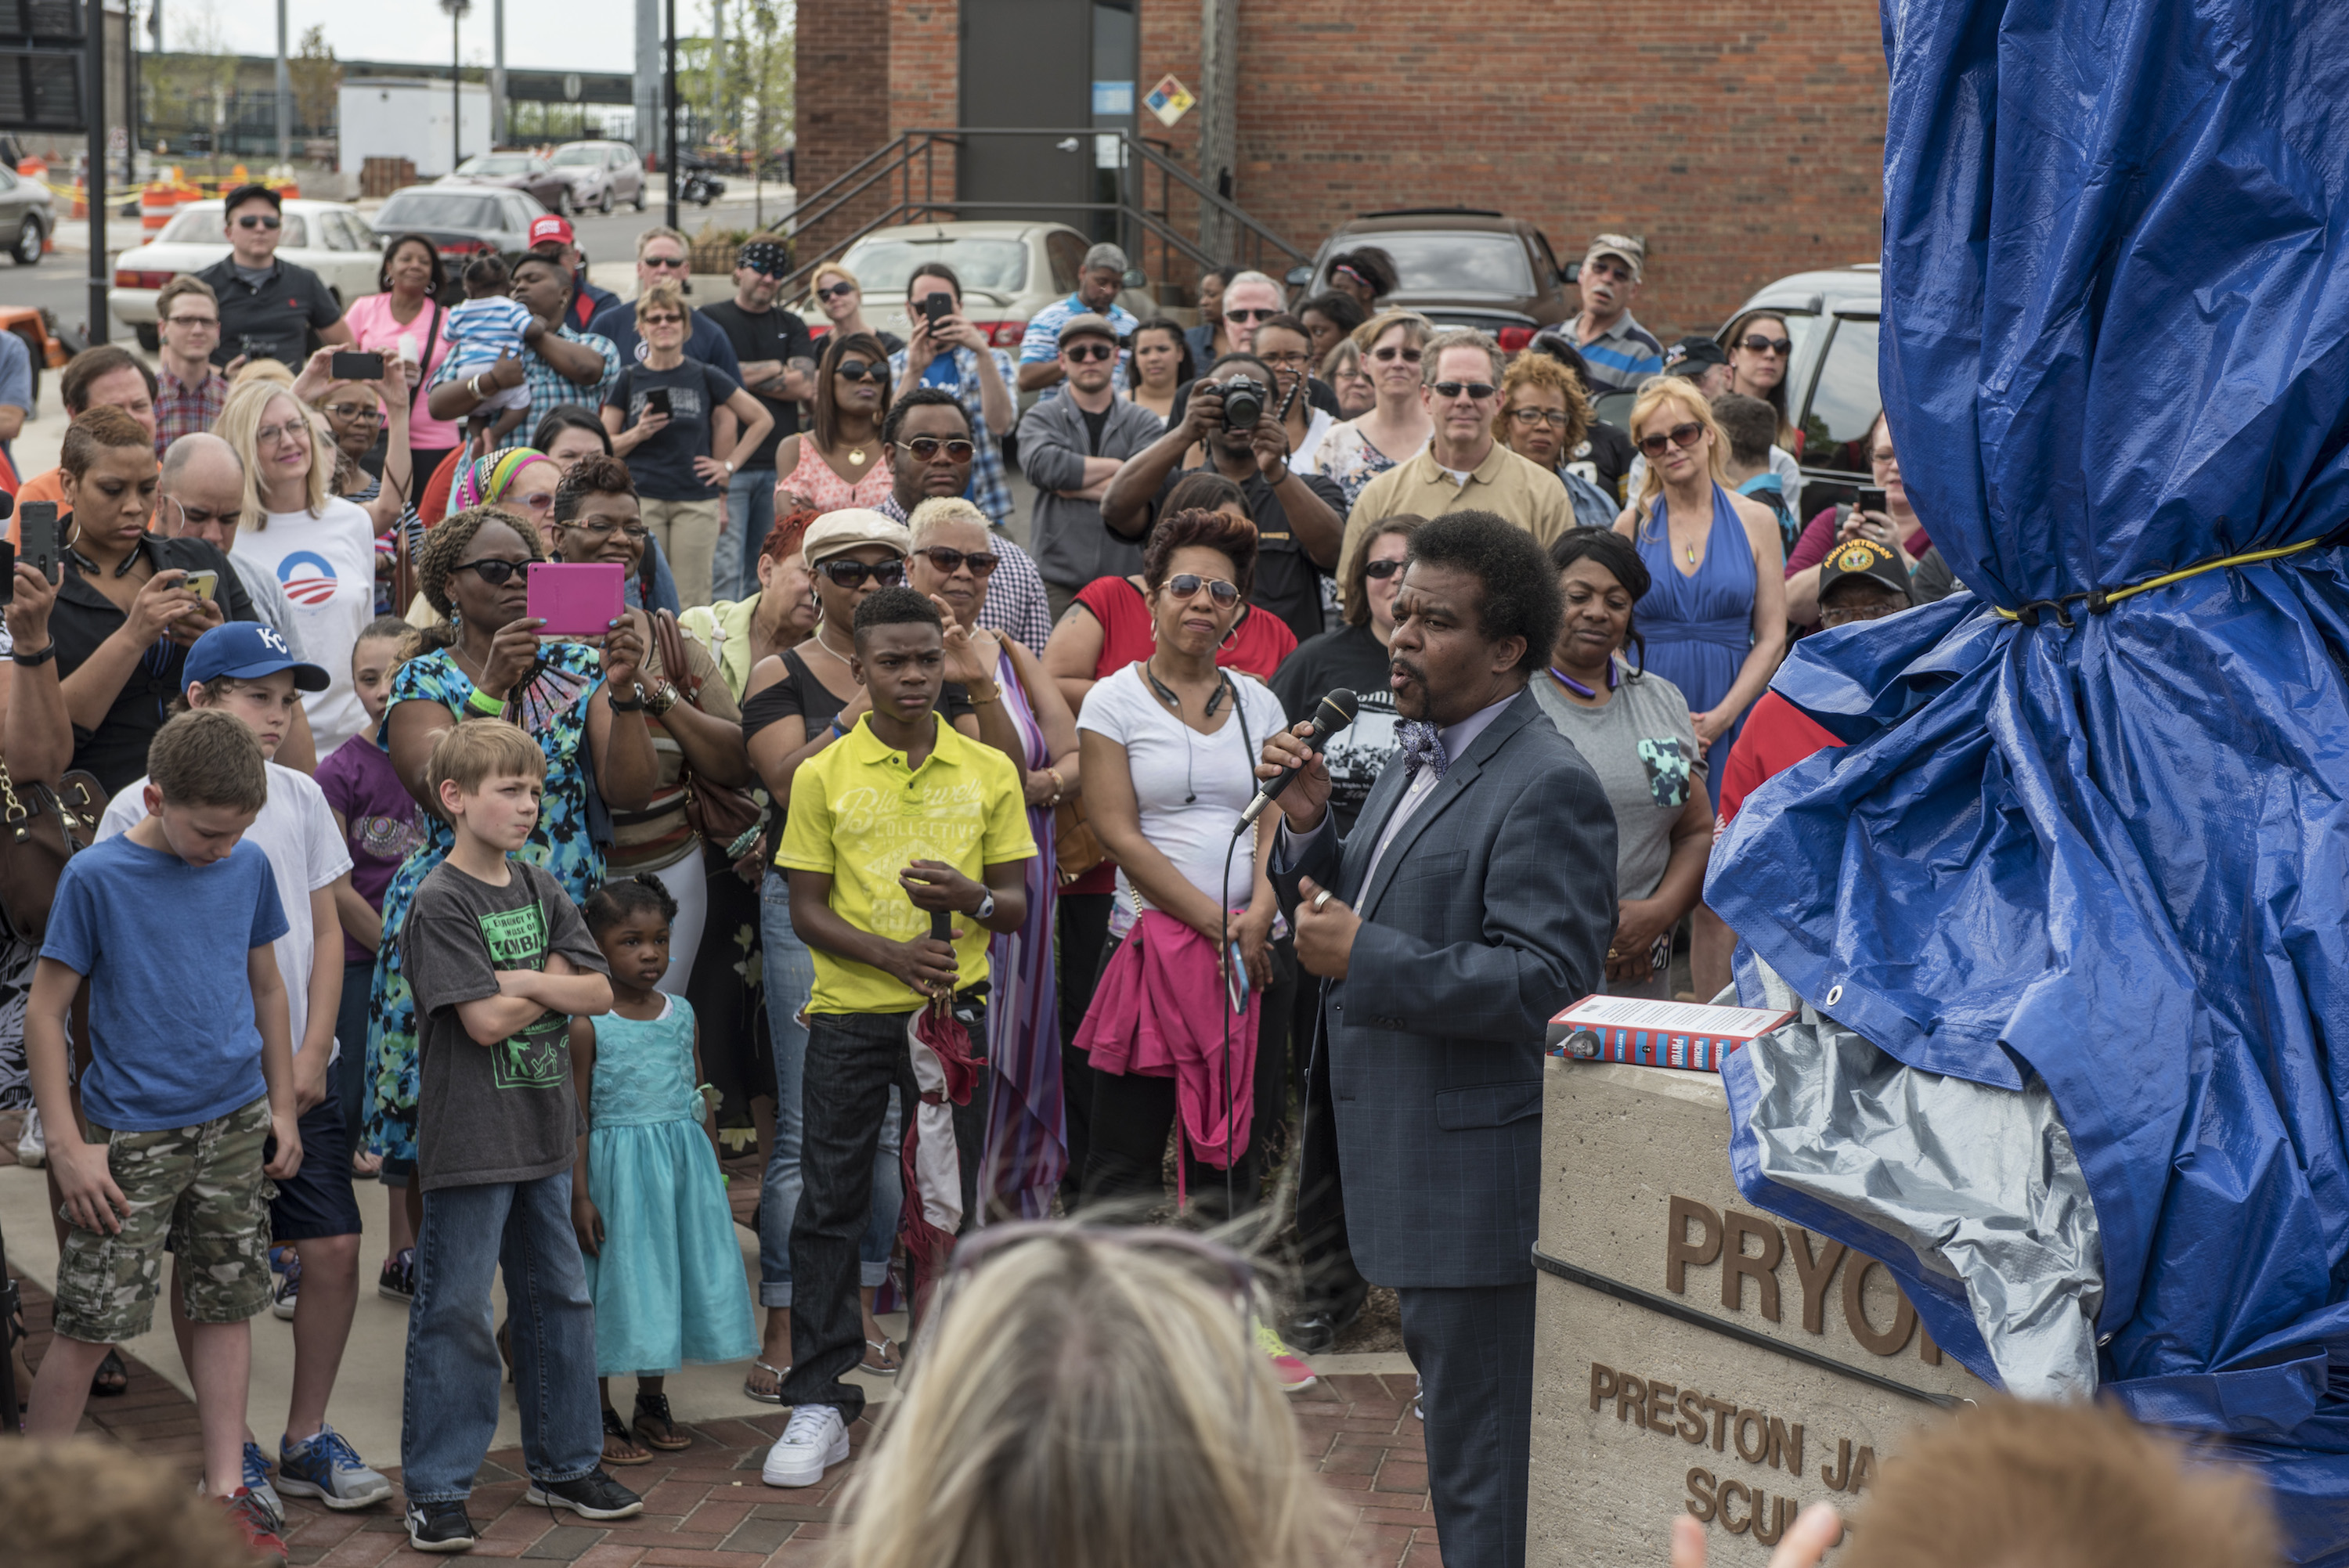
A large and diverse crowd of over 300 gathered to watch the unveiling, which was hosted by Garry Moore and featured brief comments from Mayor Jim Ardis, Councilwoman Denise Moore, State Rep. Jehan Gordon, Pryor Jr., Rev. Howard Johnson and the artist, Preston Jackson.
“Thank God we finally got this done…it’s important to our city and to our country,” said Mayor Ardis, undoubtedly summing up the feelings of the hundreds in attendance. Give Ardis credit – he has always been a supporter of the cause going back to his days on the city council.
Even though Pryor’s standup career spanned from the ‘70s into the early ‘80s (and he stopped making movies in the late ‘80s), his influence clearly extends beyond only those who are old enough to remember him. A good example of that was Peorian Richard Kirchgessner, who turned out with his son, Michael – two generations of Pryor fans.
“I’ve always been a fan and he (son Michael) learned from me,” said Richard.
As the statue is located adjacent to the Peoria Historical Society, the organization set up a display of historic photos of homes and bars related to Pryor’s life, none of which are standing today.
“We are really excited (about the statue) because now we get to see Richard every day,” said Mark Johnson, Peoria Historical Society President.
While most in attendance were from Peoria, quite a few were from out of town including, most notably, the lovely Red Hat Divas from Springfield, Ill., who cut a colorful figure in their crimson and purple ensembles.
John Viramontes travelled from Chicago not only out of respect for Pryor, whom he saw perform at Chicago’s Arie Crown Theater, but also for artist Preston Jackson as well.
“It has only been since 2004 that I've come to realize the importance of the arts. Before 2004, I was basically an outsider looking in regarding the art world,” he says. “I owe it to Preston Jackson, (Chicago artist) Chapman Kelley and other creatives who changed my view of art and its place in the world.”
The day marked the end of a long, nine-year road to get the statue created and, ultimately, financed. The latter proved to be, as with so many things in the art world, the biggest challenge.
Created by Jackson and championed by the African-American Hall of Fame, the project itself had been in something of a holding pattern the past couple of years as the group attempted to raise the $130,000 needed to complete the 7-1/2’ bronze sculpture.
Thankfully, in September 2014, the project got the boost it needed in the form of comedians George Lopez, Mike Epps, D.L. Hughley, Eddie Griffin, Cedric the Entertainer and Charlie Murphy who performed in a fundraiser at the Peoria Civic Center. Ticket sales from the event put the project over the top financially and planning for a May unveiling began in earnest.
On May 3, that long, tumultuous journey came to an end as the blue tarp (and a second white tarp) was pulled from the bronze visage of Pryor – captured in mid-performance – that will forever tower over the corner of State and Washington Streets.
Finally Richard Pryor has gotten the recognition (or, more directly, the love) from his hometown that he has been shown by so many others.
“Peoria opened its eyes and caught up with the rest of the world,” said Richard Jr.
The story of the prodigal son has often been brought up in the case of Richard’s relationship to Peoria. Except the wrong roles are usually assigned to the wrong players. Richard didn’t return a failure to be accepted back into the familial fold. Just the opposite. The city of Peoria, after years of running away and denouncing Richard, finally returned to him on a bright, warm Sunday afternoon in May.
And although Richard shuffled off his mortal coil so many years ago, on May 3, 2015, those who were closest to him – those with the same blood running in their veins – were on hand to finally bear witness to this return on his behalf.
It’s about time.
Photo Captions: Artist Preston Jackson and Richard Pryor Jr. say a few words before unveiling the Richard Pryor statue at the corner of State and Washington Streets in Peoria on May 3, 2015
Photo Credit: Jeff Noble, Light Field Theory
Economic growth forecast for remainder of 2015
- Details
- Published on 07 May 2015
- Written by PRNewswire
 Economic growth is expected to continue in the United States throughout the remainder of 2015, say the nation's purchasing and supply executives in their Spring 2015 Semiannual Economic Forecast. Expectations for the remainder of 2015 continue to be positive in both the manufacturing and non-manufacturing sectors.
These projections are part of the forecast issued by the Business Survey Committee of the Institute for Supply Management® (ISM®).
A brief summary includes:
Manufacturing
- Operating rate is currently 79.5 percent of normal capacity.
- Production capacity is expected to increase 3.4 percent in 2015.
- Capital expenditures are expected to increase 3.1 percent in 2015.
- Prices paid decreased 1.9 percent through the end of April 2015.
- Prices are expected to decrease a total of 0.9 percent for all of 2015, indicating an expected increase in prices of 1.0 percent for the remainder of the year.
- Manufacturing employment is expected to increase 0.7 percent during the remainder of 2015.
- Manufacturing revenues are expected to increase 3.5 percent in 2015.
- Overall, manufacturing is expected to maintain a positive growth trend in 2015.
Non-Manufacturing
- Operating rate is currently 86 percent of normal capacity.
- Production capacity is expected to increase 2.6 percent in 2015.
- Capital expenditures are expected to increase 1.5 percent in 2015.
- Prices paid increased 1 percent through the end of April 2015.
- Prices were reported to have increased 1 percent in the first four months of the year and are expected to decrease 0.4 percentage point for the rest of the year for a total net annual increase of 0.6 percent.
- Non-manufacturing employment is expected to increase 2 percent during the balance of 2015.
- Non-manufacturing revenues are expected to increase 2.9 percent in 2015.
- The non-manufacturing sector is projected to have continued growth in 2015.
Miscellaneous Manufacturing items include products such as Medical Equipment and Supplies, Jewelry, Sporting Goods, Toys and Office Supplies.
Other Services include: Equipment & Machinery Repairing; Promoting or Administering Religious Activities; Grantmaking; Advocacy; and Providing Dry-Cleaning & Laundry Services, Personal Care Services, Death Care Services, Pet Care Services, Photofinishing Services, Temporary Parking Services, and Dating Services.
A more detailed look at the survey results is below.
Manufacturing Summary
Fifty-five percent of respondents from the panel of manufacturing supply management executives predict their revenues will be 9 percent greater in 2015 compared with 2014, 16 percent expect an 8.9 percent decline, and 29 percent foresee no change in revenue. This yields an overall average expectation of 3.5 percent revenue growth among manufacturers in 2015, which is a meaningful decrease of 2.1 percentage points from December 2014 when the panel predicted a 5.6 percent increase in 2015 revenues.
With operating capacity at 79.5 percent, an expected capital expenditure increase of 3.1 percent, prices paid for raw materials expected to decrease a 0.9 percentage point for all of 2015 compared with 2014, and employment expected to grow 0.7 percent for the balance of 2015, manufacturing is positioned to grow revenues while containing costs through the remainder of the year. "With 14 of the 18 industries within the manufacturing sector predicting revenue growth in 2015 when compared to 2014, U.S. manufacturing continues to move in a positive direction," said Bradley J. Holcomb, chairman of ISM’s Manufacturing Business Survey Committee.
The 14 industries reporting expectations of growth in revenue for 2015 — listed in order — are: Nonmetallic Mineral Products; Paper Products; Primary Metals; Furniture & Related Products; Machinery; Textile Mills; Food, Beverage & Tobacco Products; Fabricated Metal Products; Plastics & Rubber Products; Chemical Products; Miscellaneous Manufacturing; Electrical Equipment, Appliances & Components; Computer & Electronic Products; and Transportation Equipment.
Non-Manufacturing Summary
Fifty-four percent of non-manufacturing purchasing and supply executives expect their 2015 revenues to be greater by 8.9 percent than in 2014. Overall, respondents currently expect a 2.9 percent net increase in overall revenues, which is less than the 10 percent increase that was forecast in December 2014. "Non-manufacturing will continue to grow for the balance of 2015. Non-manufacturing companies continue to operate very efficiently as reflected by the high percentage of capacity utilization. Supply managers have indicated that overall costs have been minimally impacted with pricing projected to increase 0.6 percent over the year. Overall employment is projected to grow a modest 2 percent. Thirteen out of 18 industries are forecasting increased revenues which is less than the 17 industries that forecasted increased revenues last year. Despite a cooling off in the rate of growth, the non-manufacturing sector will continue on the path of economic growth throughout the year," said Anthony S. Nieves, chairman of ISM’s Non-Manufacturing Business Survey Committee.
The 13 non-manufacturing industries expecting increases in revenue in 2015 — listed in order — are: Retail Trade; Transportation & Warehousing; Wholesale Trade; Construction; Agriculture, Forestry, Fishing & Hunting; Professional, Scientific & Technical Services; Information; Finance & Insurance; Accommodation & Food Services; Health Care & Social Assistance; Arts, Entertainment & Recreation; Public Administration; and Educational Services.
OPERATING RATE
Manufacturing
Purchasing and supply managers report that their companies are currently operating on average at 79.5 percent of normal capacity, representing a decrease from the 83.7 percent reported in December 2014, as well as a decrease from the 82.3 percent reported in April 2014. The 12 industries reporting operating capacity levels at or above the average capacity of 79.5 percent — listed in order — are: Wood Products; Paper Products; Plastics & Rubber Products; Nonmetallic Mineral Products; Apparel, Leather & Allied Products; Miscellaneous Manufacturing; Chemical Products; Printing & Related Support Activities; Fabricated Metal Products; Food, Beverage & Tobacco Products; Furniture & Related Products; and Primary Metals.
Non-Manufacturing
Non-manufacturing purchasing and supply executives report that their organizations are currently operating at 86 percent of normal capacity. This is 1.6 percent less than what was reported in December 2014 and less than the 86.3 percent reported in April 2014. The following nine industries operating at capacity levels above the average rate of 86 percent — listed in order — are: Real Estate, Rental & Leasing; Educational Services; Information; Utilities; Agriculture, Forestry, Fishing & Hunting; Public Administration; Retail Trade; Health Care & Social Assistance; and Finance & Insurance.
| Operating Rate | ||||||
| Manufacturing | Non-Manufacturing | |||||
| April 2014 |
Dec 2014 |
April 2015 |
April 2014 |
Dec 2014 |
April 2015 |
|
| 90%+ | 42% | 49% | 31% | 57% | 56% | 53% |
| 50%-89% | 54% | 48% | 63% | 41% | 42% | 46% |
| Below 50% | 4% | 3% | 6% | 2% | 2% | 1% |
| Est. Overall Average | 82.3% | 83.7% | 79.5% | 86.3% | 87.6% | 86.0% |
PRODUCTION CAPACITY
Manufacturing
Production capacity in manufacturing is expected to increase 3.4 percent in 2015. This increase is less than the 5.6 percent increase predicted in December 2014 for 2015, and also less than the 5.3 percent increase reported in December for all of 2014. This nevertheless reflects the continuing strength in the sector as 42 percent of respondents expect an average capacity increase of 10.7 percent, 9 percent expect decreases averaging 13.5 percent, and 49 percent expect no change. The 13 industries expecting production capacity increases for 2015 — listed in order — are: Nonmetallic Mineral Products; Textile Mills; Transportation Equipment; Electrical Equipment, Appliances & Components; Furniture & Related Products; Paper Products; Food, Beverage & Tobacco Products; Chemical Products; Fabricated Metal Products; Machinery; Plastics & Rubber Products; Apparel, Leather & Allied Products; and Primary Metals.
| Manufacturing Production Capacity | ||||||
| For 2014 | For 2015 | For 2015 | ||||
| Reported Dec 2014 |
Magnitude of Change |
Predicted Dec 2014 |
Magnitude of Change |
Predicted April 2015 |
Magnitude of Change |
|
| Higher | 47% | +12.7% | 53% | +11.6% | 42% | +10.7% |
| Same | 48% | NA | 41% | NA | 49% | NA |
| Lower | 5% | -15.0% | 6% | -10.3% | 9% | -13.5% |
| Net Average | +5.3% | +5.6% | +3.4% | |||
Non-Manufacturing
The capacity to produce products or provide services in the non-manufacturing sector is expected to increase 2.6 percent during 2015. This compares to an increase of 3.6 percent reported for 2014 and a prediction inDecember 2014 for an increase of 4.3 percent for 2015. For 2015, 23 percent of non-manufacturing respondents expect their capacity to increase by an average of 14 percent, and 6 percent of the respondents foresee their capacity decreasing by an average of 11 percent. Seventy-one percent expect no change in their capacity. The nine industries expecting to add to their production capacity in 2015 — listed in order — are: Accommodation & Food Services; Retail Trade; Finance & Insurance; Information; Public Administration; Wholesale Trade; Management of Companies & Support Services; Health Care & Social Assistance; and Other Services.
| Non-Manufacturing Production or Provision Capacity | ||||||
| For 2014 | For 2015 | For 2015 | ||||
| Reported Dec 2014 |
Magnitude of Change |
Predicted Dec 2014 |
Magnitude of Change |
Predicted April 2015 |
Magnitude of Change |
|
| Higher | 29% | +12.9% | 40% | +11.1% | 23% | +14% |
| Same | 70% | NA | 59% | NA | 71% | NA |
| Lower | 1% | -5.0% | 1% | -12.5% | 6% | -11% |
| Net Average | +3.6% | +4.3% | +2.6% | |||
PREDICTED CAPITAL EXPENDITURES — 2015 vs. 2014
Manufacturing
Survey respondents expect a 3.1 percent increase in capital expenditures in 2015. This is less than theDecember 2014 forecast when the panel predicted an increase of 3.7 percent for 2015. Currently, 29 percent of respondents predict increased capital expenditures in 2015, with an average increase of 31 percent, and the 20 percent who said their capital spending would decrease an average of 30.2 percent. Fifty-one percent say they will spend the same in 2015 as they did in 2014. The nine industries expecting increases in capital expenditures in 2015 compared to 2014 — listed in order — are: Nonmetallic Mineral Products; Transportation Equipment; Fabricated Metal Products; Primary Metals; Chemical Products; Food, Beverage & Tobacco Products; Paper Products; Miscellaneous Manufacturing; and Electrical Equipment, Appliances & Components.
Non-Manufacturing
Non-manufacturing purchasing and supply executives are expecting to increase their level of capital expenditures 1.5 percent in 2015 compared to 2014. The 34 percent of members expecting to spend more predict an average increase of 16.9 percent. Sixteen percent of respondents anticipate a decrease averaging 26.7 percent. Fifty percent of the respondents expect to spend the same on capital expenditures in 2015 as in 2014. The eight industries expecting an increase in capital expenditures in 2015 from 2014 — listed in order — are: Accommodation & Food Services; Retail Trade; Professional, Scientific & Technical Services; Agriculture, Forestry, Fishing & Hunting; Finance & Insurance; Wholesale Trade; Arts, Entertainment & Recreation; and Management of Companies & Support Services.
| Predicted Capital Expenditures 2015 vs. 2014 | ||||||
| Manufacturing | Non-Manufacturing | |||||
| Predicted Dec 2014 |
Predicted April 2015 |
Magnitude of Change |
Predicted Dec 2014 |
Predicted April 2015 |
Magnitude of Change |
|
| Higher | 35% | 29% | +31.0% | 40% | 34% | +16.9% |
| Same | 44% | 51% | NA | 43% | 50% | NA |
| Lower | 21% | 20% | -30.2% | 17% | 16% | - 26.7% |
| Net Average | +3.7% | +3.1% | +3.8% | +1.5% | ||
EMPLOYMENT
Change in Overall Employment – Balance 2015
Manufacturing
ISM's Manufacturing Business Survey respondents forecast that manufacturing employment will increase 0.7 percent during the balance of 2015, with 33 percent expecting employment to be 5.4 percent higher. Fifteen percent of respondents predict employment to be lower by 7.1 percent. The remaining 52 percent of respondents expect their employment levels to be unchanged for the remainder of 2015. The 11 industries reporting expectations of growth in employment during the year — listed in order — are: Nonmetallic Mineral Products; Textile Mills; Furniture & Related Products; Plastics & Rubber Products; Electrical Equipment, Appliances & Components; Fabricated Metal Products; Chemical Products; Miscellaneous Manufacturing; Primary Metals; Machinery; and Computer & Electronic Products.
Non-Manufacturing
ISM's Non-Manufacturing Business Survey Committee respondents forecast that employment will increase 2 percent during the balance of 2015. For the remaining months of 2015, 33 percent expect employment to increase 7.6 percent, 9 percent anticipate employment to decrease by 6.1 percent, and 58 percent expect their employment levels to be unchanged. The 14 industries anticipating increases in employment in the remaining months of 2015 — listed in order — are: Retail Trade; Finance & Insurance; Accommodation & Food Services; Professional, Scientific & Technical Services; Wholesale Trade; Construction; Health Care & Social Assistance; Public Administration; Management of Companies & Support Services; Other Services; Information; Arts, Entertainment & Recreation; Real Estate, Rental & Leasing; and Agriculture, Forestry, Fishing & Hunting.
| Predicted Change in Overall Employment | ||||||
| Manufacturing | Non-Manufacturing | |||||
| Predicted for 2015 Dec 2014 |
Balance of April 2015 |
Magnitude of Change |
Predicted for 2015 Dec 2014 |
Balance of April 2015 |
Magnitude of Change |
|
| Higher | 36% | 33% | +5.4% | 38% | 33% | +7.6% |
| Same | 49% | 52% | NA | 50% | 58% | NA |
| Lower | 15% | 15% | -7.1% | 12% | 9% | -6.1% |
| Net Average | +1.5% | +0.7% | +1.7% | +2.0% | ||
| Diffusion Index | 60.5% | 59.0% | 63.0% | 62.0% | ||
Tammone named interim president at ICC
- Details
- Published on 05 May 2015
- Written by The Peorian
 Dr. William Tammone, provost at Illinois Central College, will serve as interim president of the college until a new president is named, the ICC Board of Trustees decided Monday.
The board also decided to begin a search for its new president to replace Dr. John Erwin, who retired last week after 14 years as president.
Tammone has been at ICC nearly six years. He has served as the vice president for academic services and provost.
He earned his PhD in history and the philosophy of science from Indiana University. He received his bachelor’s and master’s degrees from the University of Chicago in biology, sciences related to human biology, and medicine.
Prior to his tenure at ICC, Tammone was Vice President for Academic Services at Montcalm Community College in Sidney, Michigan.
